Claude
@claudeai
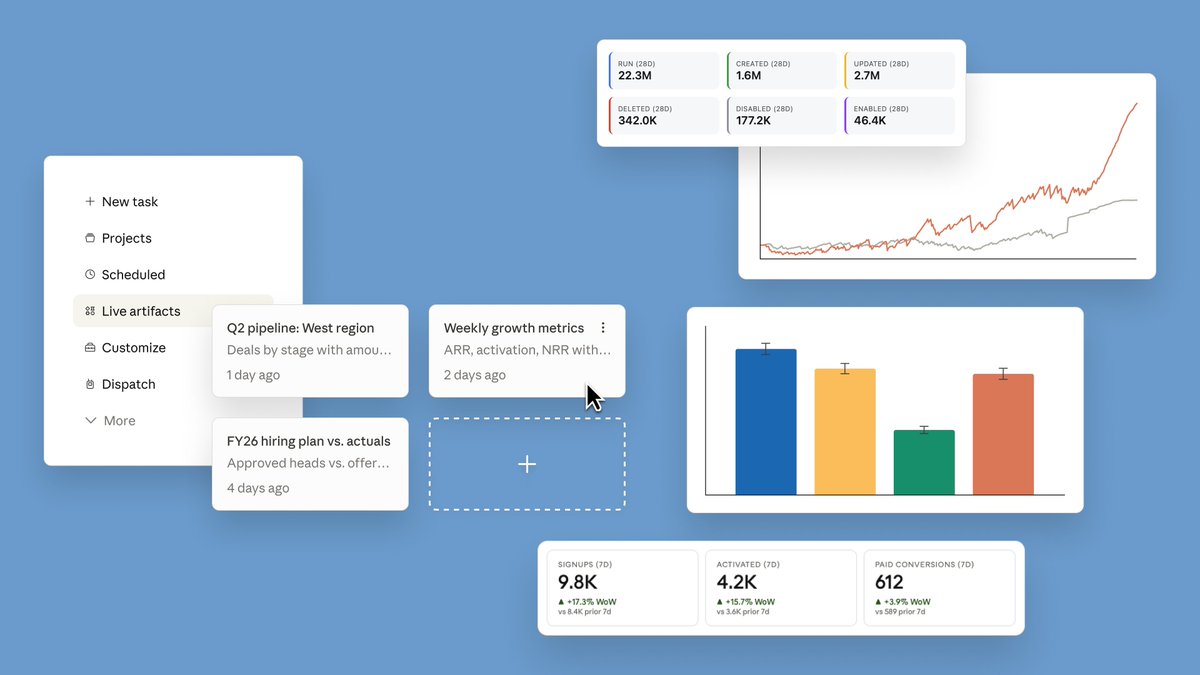
Claude can now build interactive charts and diagrams, directly in the chat. Available today in beta on all plans, including free. Try it out: https://t.co/tHPAZRgQkn https://t.co/WXRrD4VkAt
3kretweets
View on X· Updated
Claude can now generate interactive charts and diagrams directly inside the chat window. The feature is in beta across all plans, including free, closing a gap with ChatGPT and Gemini that already offered in-chat visualization.
This is Anthropic expanding Claude's output capabilities beyond text and code. Competing assistants like ChatGPT and Gemini already render charts in-chat, so this closes a visible gap in Claude's feature set. Launching across all tiers, including free, makes it immediately accessible to Claude's entire user base.
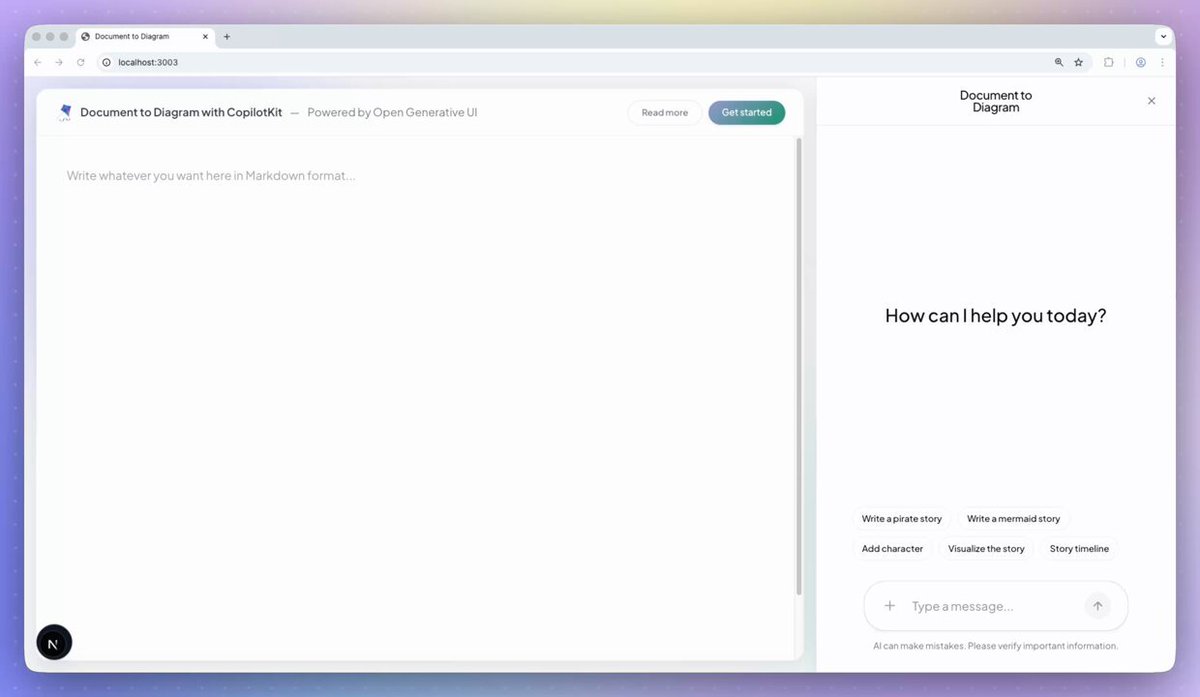
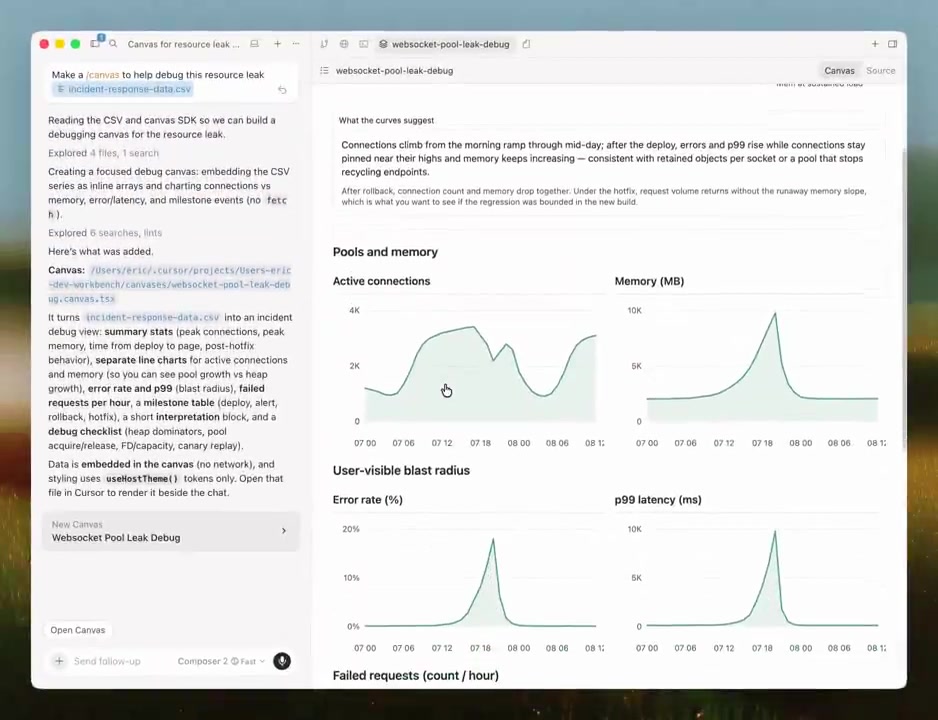
Open a Claude conversation, describe your dataset or system, and ask for a chart or diagram. The interactive output lets you explore the data right inside the thread.
Claude can now build interactive charts and diagrams, directly in the chat. Available today in beta on all plans, including free. Try it out: https://t.co/tHPAZRgQkn https://t.co/WXRrD4VkAt
Every HeadsUpAI update is written based on its original source and reviewed before it's published. Read our editorial standards →
More like this