ChatGPT
@ChatGPTapp
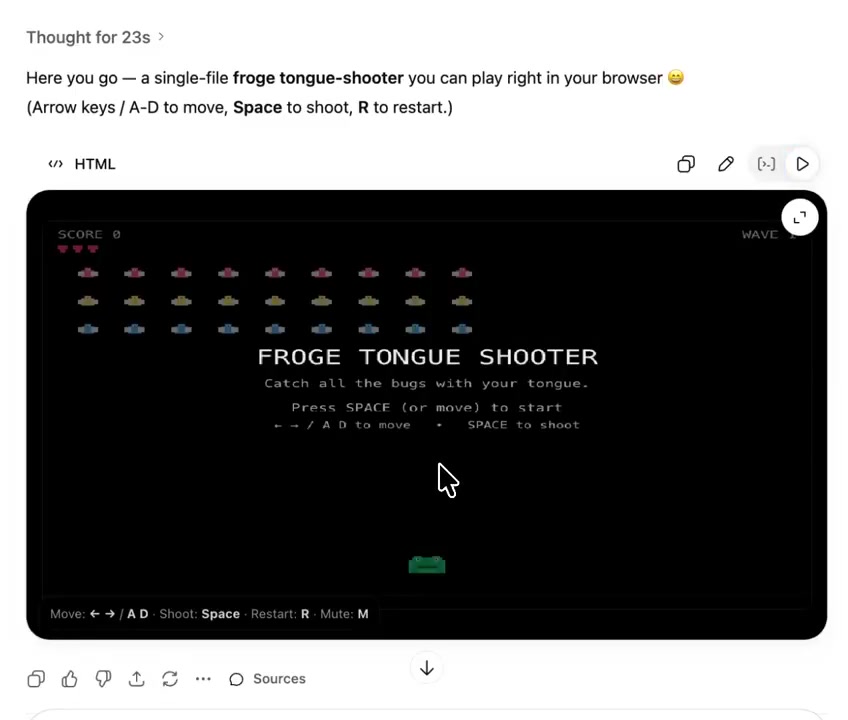
Turn data and comparisons into charts, directly in ChatGPT. Available now on mobile and web. https://t.co/rZ7KJsvXBw
211retweets3klikes
View on X· Updated
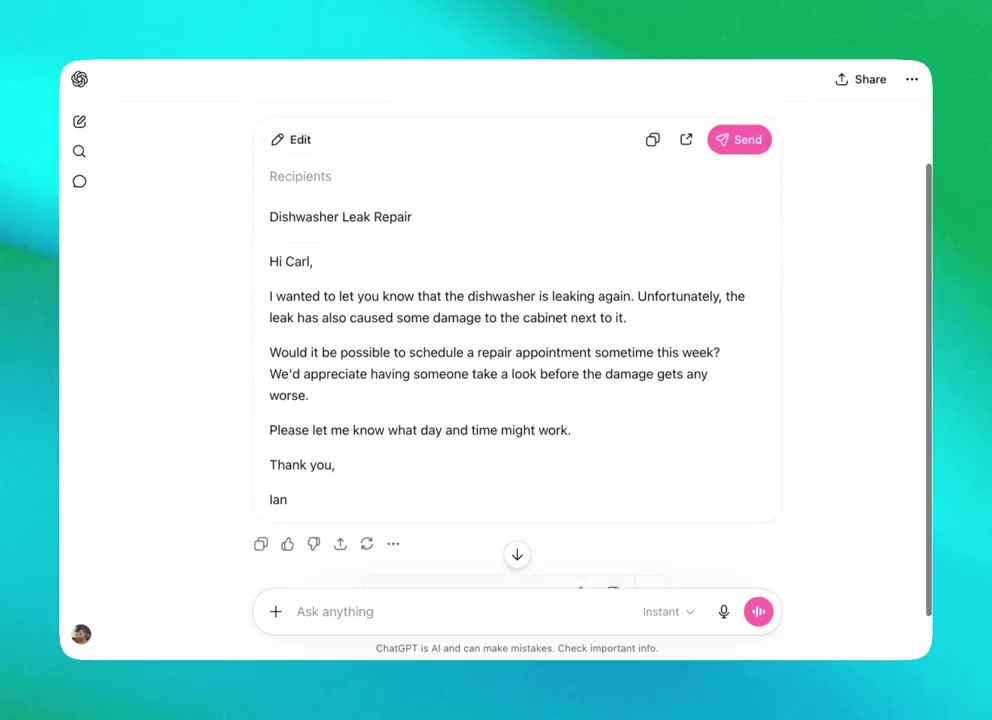
OpenAI's ChatGPT now generates charts from uploaded data directly within the chat interface. This update brings data visualization capabilities to both mobile and web, enhancing in-chat analysis for users.
This update expands ChatGPT's integrated capabilities, enabling more sophisticated data analysis and visualization directly in conversations. It aligns with a broader industry trend of making advanced AI features accessible, similar to how Claude also offers in-chat interactive chart generation.
ChatGPT's data analysis feature is available on mobile and web. Upload structured data, specify desired calculations or chart types, and review the Python code and assumptions used for analysis before relying on the results.
Turn data and comparisons into charts, directly in ChatGPT. Available now on mobile and web. https://t.co/rZ7KJsvXBw
Still wondering? A few quick answers below.
Every HeadsUpAI update is written based on its original source and reviewed before it's published. Read our editorial standards →