Vercel Labs introduced a local web dashboard for its agent-browser CLI that provides a live visual feed and activity log of AI agent interactions. This observability layer addresses the black-box nature of headless automation by letting developers monitor browser console, network, and storage state in real time.
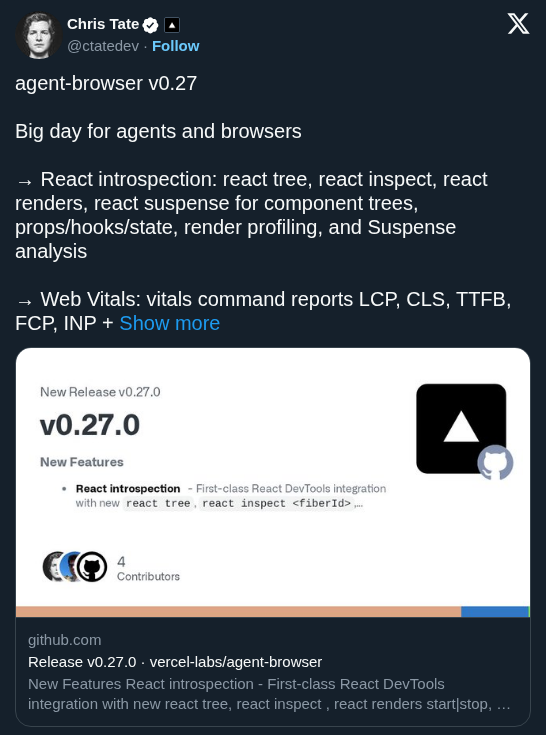
Vercel Labs released a local observability dashboard for agent-browser, a native Rust CLI for AI agent automation. The dashboard runs as a background process on port 4848, offering a live viewport via real-time JPEG frames. It centralizes session management, allowing you to track multiple active agents from one interface.
Debugging agentic workflows in headless environments is difficult because failures often happen without visual context. This update provides a chronological activity feed of every command and result. By exposing the browser console and network requests, it allows for precise troubleshooting when an agent fails to navigate complex interfaces.
Enable the feature by running agent-browser dashboard install followed by agent-browser dashboard start. Active sessions automatically stream to the dashboard, where you can inspect metadata and timing for each step. The tool is open-source under the Apache-2.0 license and supports both local Chromium and cloud-based browser providers.