Building apps is easy- keeping them running isn’t Introducing Replit Application Monitoring Replit Agent now watches your app in production, investigates issues, and helps fix them- so you don’t have to
Replit Launches AI App Monitoring to Automate Production Incident Response
· Updated
Replit, a software development platform, launched App Monitoring to automate the maintenance of published applications. The suite provides real-time uptime tracking and proactive alerts integrated with the platform's AI agent. The agent can now investigate production logs and read-only databases to identify root causes.
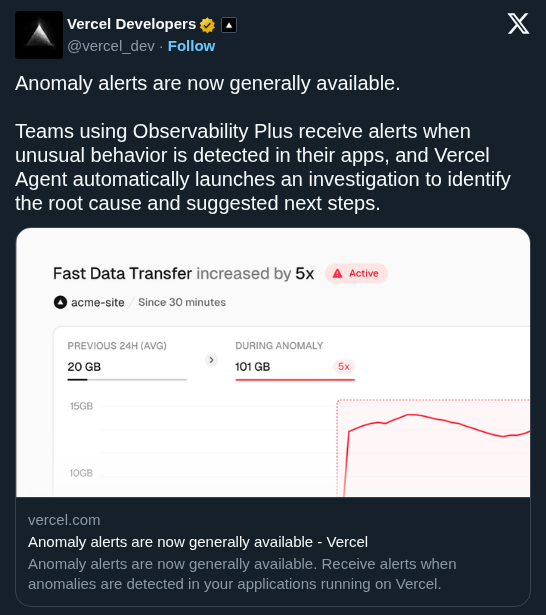
This update shifts the AI's role from a coding assistant to an automated site reliability engineer. By providing the agent with direct visibility into production telemetry (data about system performance), Replit is standardizing a workflow where AI manages the software lifecycle. This follows a pattern seen in Vercel's automated incident response.
You can enable App Monitoring through the Publishing settings in any project to receive downtime alerts and uptime analytics. The feature is available now for all users on the Replit platform.
Replit â •
@Replit
11retweets177likes
View on XStill wondering? A few quick answers below.
Replit App Monitoring is a production toolset designed to help developers maintain live applications. It provides real-time uptime tracking, visual analytics to correlate downtime with traffic spikes, and automated alerting. The system integrates with Replit Agent, allowing the AI to investigate failures and identify root causes the moment an application experiences issues.
When an application goes down, users can trigger a background task for Replit Agent to investigate the failure. The agent autonomously sifts through production logs and accesses the application database to pinpoint specific issues. It can identify whether a failure was caused by a logic bug, a misbehaving database query, or an integration error.
No, Replit Agent is restricted to read-only access when interacting with a production database. This security measure ensures the agent can diagnose issues and identify root causes without the risk of making unauthorized or accidental modifications to live data. Users can ask the agent to investigate production details at any time, not just during outages.
To enable App Monitoring, navigate to the Publishing settings within your specific Replit project. Once activated, the system will display a recent uptime graph and provide access to deeper analytics. You will also receive automated email notifications the moment your published application goes down, allowing you to take immediate action or delegate the investigation to the agent.
The dashboard provides a visual uptime graph and an analytics view to help correlate downtime with external signals. Users can view request volume and traffic spikes to determine if user load is exceeding the application's provisioned capacity. It also displays recent uptime at a glance, showing whether an app is currently down or had issues previously.


