HeadsUpAI

OpenRouter Launches Model Comparison Tool to Visualize Real World Performance

OpenRouter, a unified API platform for accessing hundreds of language models, launched a comparison interface to visualize model performance and economics. The tool aggregates live data on p50 latency (the time it takes for half of requests to complete) and throughput alongside granular pricing for input, output, and cached tokens.
Performance metrics
p50 latency and p50 throughput
Token tracking
Prompt, Completion, and Reasoning tokens
Benchmark categories
Intelligence, Coding, and Agentic
Pricing metrics
Input, Output, and Cached input
Design Arena tasks
SVG, UI components, and Game Dev

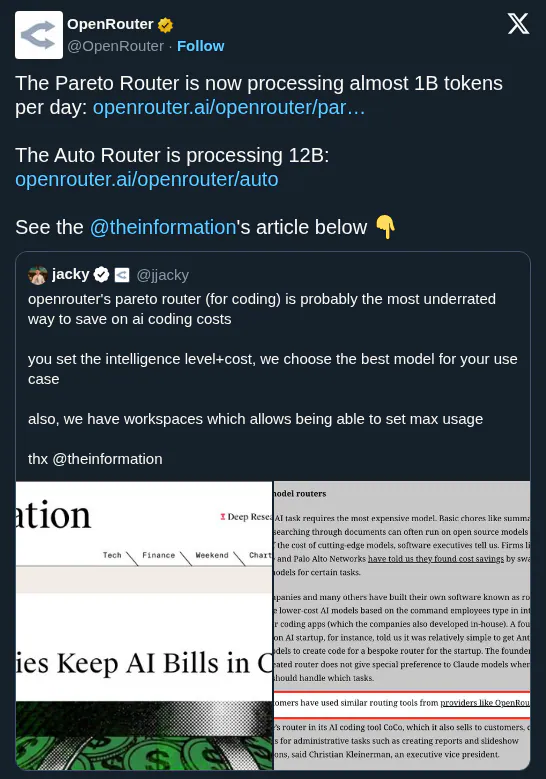
As reasoning models become standard, static benchmarks no longer capture the full operational picture. This update provides transparency into production behavior, including 30-day usage trends that distinguish between prompt, completion, and reasoning tokens (tokens generated during internal deliberation). It follows OpenRouter's Pareto Code launch.

You can compare specific model variants, such as adaptive reasoning modes, across multiple providers. The Design Arena section also offers specialized rankings for tasks like SVG generation, which complements OpenRouter's Recraft V4.1 integration for vector graphics. The comparison tool is available for free on the OpenRouter website.

OpenRouter
OpenRouter
@OpenRouter
X

Don't rely on benchmarks; look at the full picture! Try our new Compare page, which also lets you visualize model performance: https://t.co/lc6teV2Tpz https://t.co/onsVfvu7vs

9retweets133likes
View on X

Still wondering? A few quick answers below.

The OpenRouter Compare tool is a specialized interface designed to help developers evaluate hundreds of large language models side-by-side. It moves beyond static benchmark scores by providing real-time data on production performance, including actual latency and throughput metrics, to help users choose the most efficient model for their specific application needs.

OpenRouter measures performance using p50 latency and p50 throughput, which represent the median speed and data volume processed by a model across different providers. The tool also visualizes 30-day activity trends, allowing users to see the volume of prompt, completion, and reasoning tokens, which are the internal tokens generated during a model's deliberation process.

The tool provides a detailed breakdown of costs for each model, including pricing for input tokens, output tokens, and cached input tokens. This transparency allows developers to calculate the exact unit economics of different models and providers, helping them balance high-performance reasoning capabilities with the long-term operational costs of their AI features.

Yes, the comparison tool allows you to evaluate specific model configurations and reasoning tiers. For example, you can compare GPT-5.5 reasoning levels against Anthropic's Claude Opus variants using Adaptive Reasoning or Max Effort modes. This helps users understand how different levels of test-time compute affect both the intelligence of the output and the final cost.

The Design Arena is a specialized benchmarking section within the comparison tool that ranks models on their ability to handle visual and structural tasks. It provides specific performance percentages for categories such as SVG generation, UI component creation, website building, and data visualization, helping developers identify which models excel at generating code for frontend and design-heavy applications.

Share this update