ClaudeDevs
@ClaudeDevs
We've added an observability dashboard for developers of connectors. Connectors let third-party developers bring their tools and data to Claude via MCP. https://t.co/PSiMHjwFGL
116retweets2.2klikes
View on X· Updated
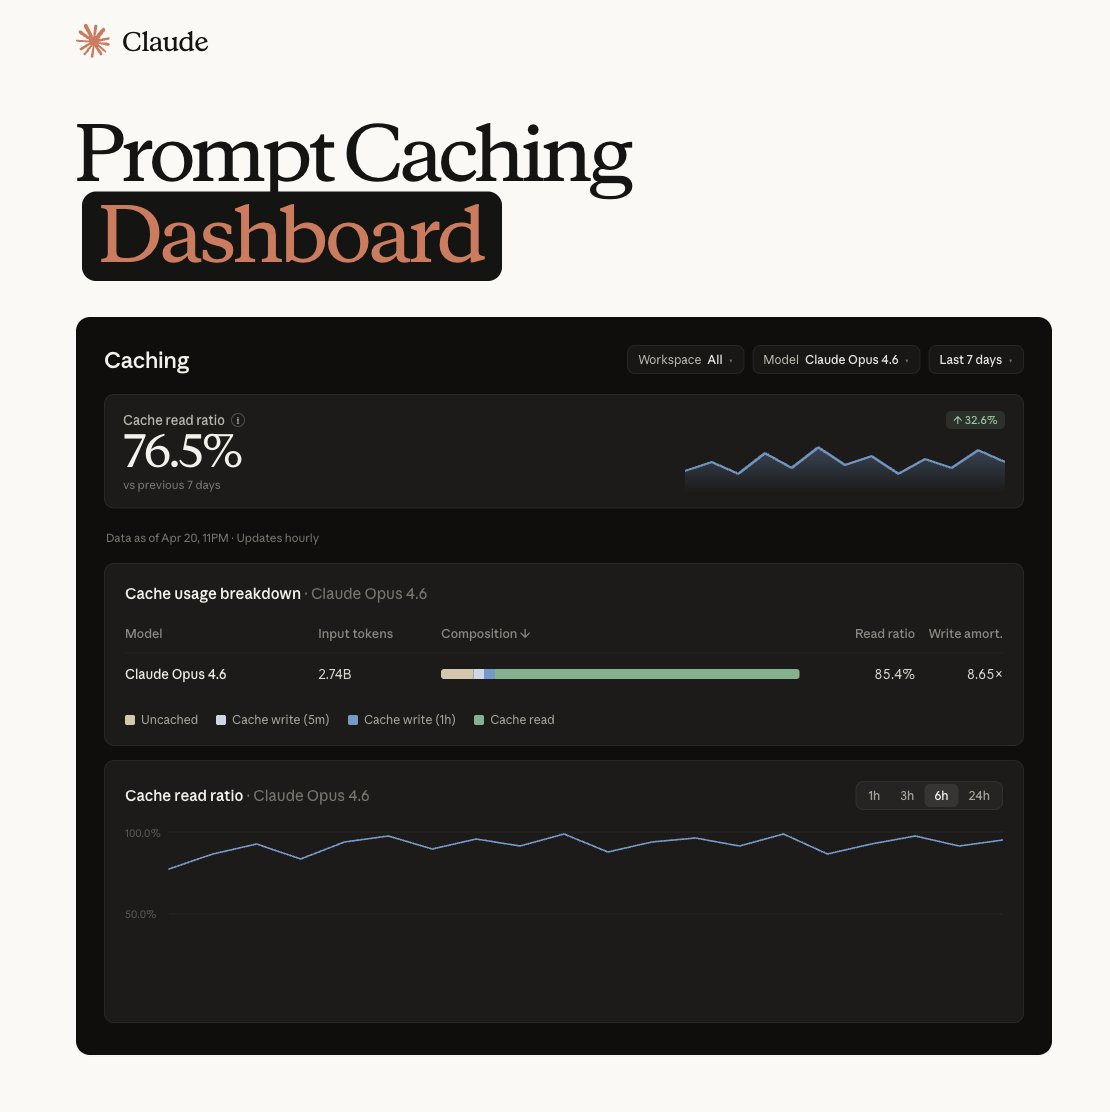
Anthropic introduced an observability dashboard and an in-app submission portal for developers building connectors for Claude. These tools allow third-party developers to monitor connector performance, diagnose issues, and streamline the process of integrating their tools and data via the Model Context Protocol (MCP).
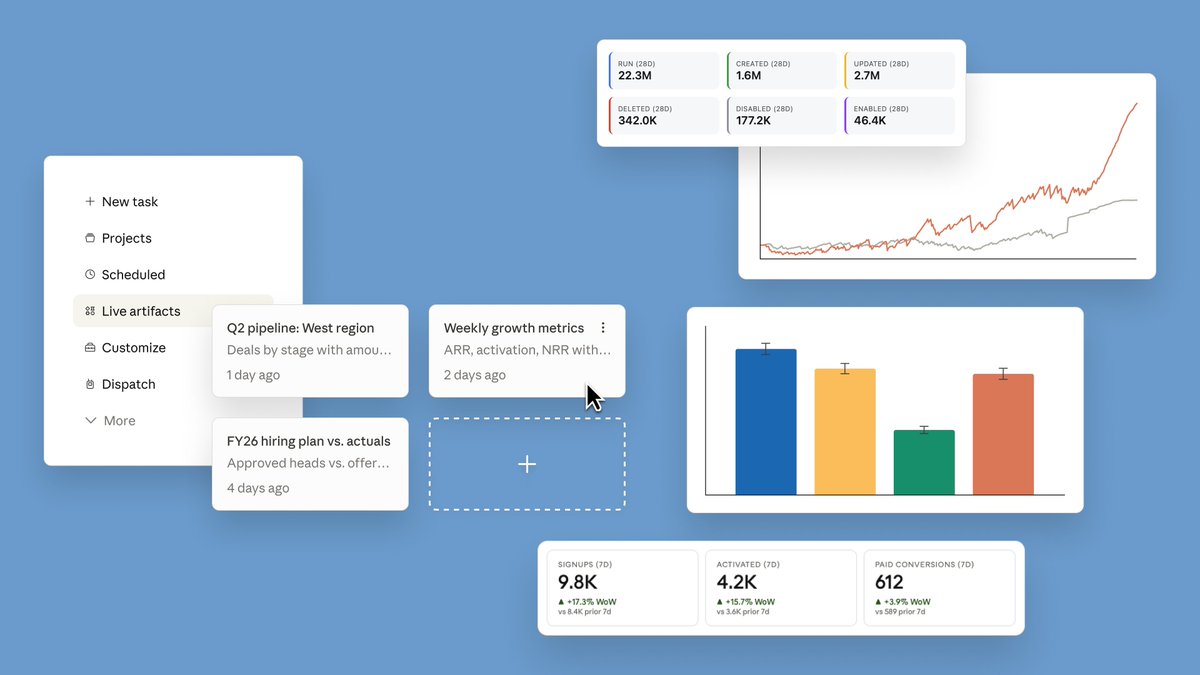
The dashboard helps developers track adoption, diagnose errors, and understand usage across products like Claude, Claude Code, and Cowork. This visibility is crucial for Agentic Engineering (designing and operating reliable AI agent systems).
The connector observability dashboard is in public beta, found in Claude's Organization settings under Directory. Access requires a Team or Enterprise account (Admin/Owner) or a custom role with Libraries permission on Enterprise. It monitors active users, tool calls, error rates, and compares usage across Claude applications.
We've added an observability dashboard for developers of connectors. Connectors let third-party developers bring their tools and data to Claude via MCP. https://t.co/PSiMHjwFGL
Still wondering? A few quick answers below.
Every HeadsUpAI update is written based on its original source and reviewed before it's published. Read our editorial standards →